On Tuesday, July 1, The Times reported a new YouGov poll that showed support for a Yes vote at 39% (once Don’t Knows were excluded). This was one point down from the last YouGov poll two weeks ago, and three points down from a YouGov poll in March. The Times announced, “Voters are turning their backs on the bid for Scottish independence, according to a dramatic new poll that threatens to leave Alex Salmond’s hopes in tatters.”
However, we should not read too much into any one poll. Of course, if you are the Yes campaign, any poll moving against you is unwelcome news. However, the typical sampling error (i.e. the amount it could vary simply by chance) for a poll of this kind is ±3%. We cannot conclude that much from so small a movement in one poll. When trying to spot trends, it is better to combine information from multiple polls.
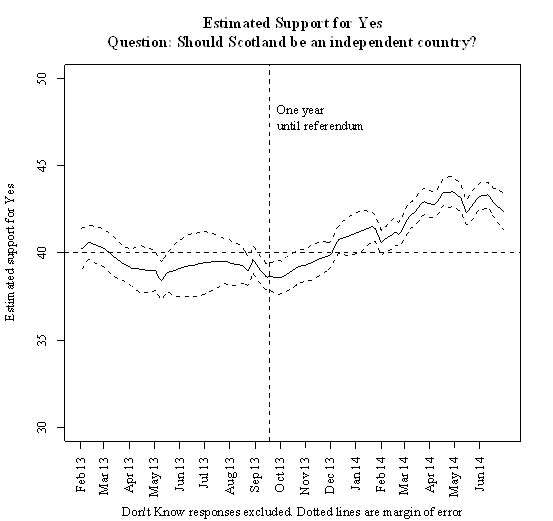
When we combine information from all the polls we have, we see a consistent picture. I use a statistical method developed by Professor Simon Jackman of Stanford University and similar to the method used with great effect by Nate Silver to predict the last US Presidential election. What this shows (see figure below) is a steady, unspectacular movement toward yes of about 4 points since last September, with some ups and down around that trend (including a slight dip in the last two weeks coinciding with two YouGov polls).
The trend is quite similar to that in the “Poll of Polls” provided by this website. However, let me explain the advantages of my approach.
There are two reasons why combining the polls on independence is difficult. Firstly, there is on average only about one poll a week. Secondly, the poll results from different survey firms vary greatly (in jargon, the “house effects” are large). The difference between the results of two different polling organizations can be more than 10 points.
The most obvious way to combine polls is simply to average them – take a poll of polls. The problem is, when you only have a few polls a month, the latest average will depend on which polling organizations have conducted a poll most recently.
Fortunately, there is a statistical technique to overcome this problem. It has only been used for a few years, but it has been thoroughly tested. I give technical details in an appendix for those interested (for full details see Jackman 2005). Essentially this technique simultaneously estimates the support for Yes on any given day, and the relative bias of each polling organization. Simplifying greatly, whether a new poll causes us to revise our estimate of the Yes vote up or down does not just depend on whether it is higher or lower than other recent polls. It depends on how it compares with other polls from the same polling organization.
For example, the Yes vote in the Ipsos Mori poll published on June 1st was lower than that in the preceding four polls from other polling companies. However, this poll would cause us to increase our estimate of Yes support because the Yes vote was substantially higher than in the previous Ipsos Mori poll (36% on February 25th). The 40% Yes vote was higher than we would have expected from previous Ipsos Mori polls.
By combining polls, we get a far lower margin of error. Our margin of error is generally around ±1%, as opposed to ±3% for an individual poll. Therefore we can be quite confident that support for Yes has increased since September last year. This is consistent with the perception that the Yes campaign has been rather more effective than the Better Together campaign, and is also consistent with the findings of my colleagues, Dr. Mark Shephard and Dr. Stephen Quinlan that the Yes campaign has been significantly more effective at online campaigning. However, since mid-April our estimate of Yes support has been rather volatile, and since then there has not been an obvious trend.
We cannot be so confident about the overall level of Yes support. The different polling companies vary amongst themselves by as much as 10 points. We will not know for sure which company is accurate until we have the referendum. This is rather different from estimating party support, where you can use the results of the last election to work out the likely accuracy of each polling company. As an expedient, I assume that the polls as a whole are accurate. That is, I assume that when you aggregate all the polls, the net bias is zero. On this basis support for Yes is estimated to be 42.3% as of July 1. Changing this assumption would not change the shape of our graph, only move it up or down. But if the assumption is correct then although it has made have made progress in the referendum campaign, the Yes side has to make a lot more between now and September.
Appendix: Methodology
The model is adapted from Jackman (2005). The statistical model is as follows:
We assume that the Yes response on day i with polling organization j, Yespcij, is normally distributed:
Yespcij ~ N(muij, sigmaij), where muij and sigmaij are the expected response and standard deviation.
The expected response, muij, depends on the level of support on day i (ai) and the house effect of polling organization j (dj):
muij = ai + dj
sigmaij = sqrt((Yespcij (1 – Yespcij)) / n) where n is the number of respondents in the poll.
We assume an uninformative prior for a1 and then assume a random walk process:
a1 ~ Uniform[30,70]
ai ~ N(ai-1, omega)
Omega is the daily variation and determines the amount of smoothing – how much to we base our estimate on the latest poll, and how much on the previous level. We force a considerable degree of smoothing, setting omega so that the month to month variation in Yes support is consistent with the random walk process:
Omega ~ Uniform[0, .17]
We choose uninformative priors for the house effects:
di ~ Uniform[-20, 20]
However, we normalize the last house effect so that bias across all polls is zero:
d9 = (∑ dj wj) / w9 where wj is the number of polls administered by polling house j.
The model was estimated using Bayesian methods in JAGS and R software. These are both available to download for free.
Bibliography
Jackman, Simon. 2005. Pooling the Polls Over an Election Campaign. Australian Journal of Political Science 40 (4):499-517.
About the author
Anthony McGann is Professor in the School of Government and Public Policy at the University of Strathclyde.