We use the Scottish Social Attitudes survey (SSA) 2014 to look here at likely turnout in the referendum, and also at who the undecideds are.
The level of turnout looks likely to be high. The survey measured respondents’ likelihood of voting on a 10-point scale, with 10 meaning ‘very likely to vote’. Nearly three quarters of people now say they are very likely to vote, up from under two thirds in 2013. Nearly nine out of ten say they are likely to vote (6-10 on a 0-10 scale). Moreover, the likelihood of voting is up no matter what people’s view is of the question in the referendum.
What characterises the undecided? As in 2013, a greater proportion of women than of men is undecided. People closer to Labour or the SNP are still (as in 2013) the most undecided, and those not close to any party have the highest level of all. Those who say they know a great deal about the issues in the referendum are now almost certain to have decided, but otherwise those who feel they know less about the referendum also are more likely to be undecided. And the more a person feels that independence would affect their own life, the more likely they are to have made up their mind.
An important source of uncertainty in deciding how to vote is in the very concept of ‘independence’. The full range of constitutional options presented to respondents in SSA 2014 is shown in Table 1: the word ‘independence’s it not used, but rather the concept that the Scottish Parliament might ‘make all decisions for Scotland’. There has been a marked rise between 2013 and 2014 in support for that option.
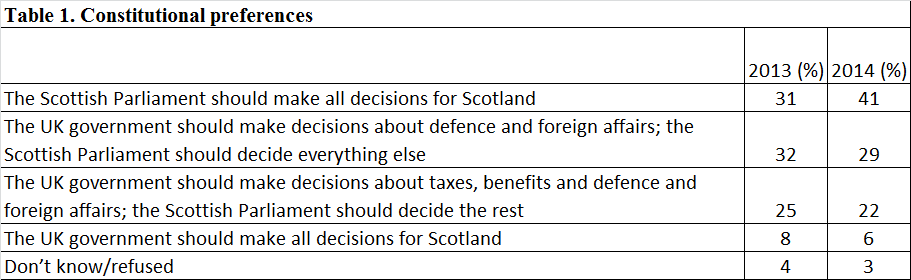
Yet, despite the rise in support for this ‘full powers’ option, people who favour it are no less undecided in 2014 than they were in 2013, and indeed only just over one half of them would vote Yes.
Part of the explanation of this discrepancy between ideal and intention is an awareness of the economic issues in the debate (Figure 1). For those who want the Scottish Parliament to make all decisions for Scotland, it shows, separately for yes voters and no voters/undecideds, what proportion of respondents holds a positive or negative outlook about the economy in an independent Scotland.
Figure 1. Expectations about the economy of an independent Scotland, by voting intention, for those favouring the Scottish Parliament deciding everything
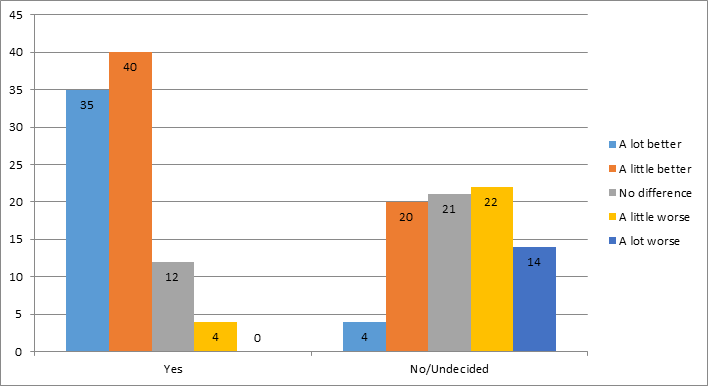
Although the number of those ideally wishing for the Scottish Parliament to run everything has grown substantially, mostly that ideal is translated into a vote for independence only if they can also be convinced that it can be afforded.
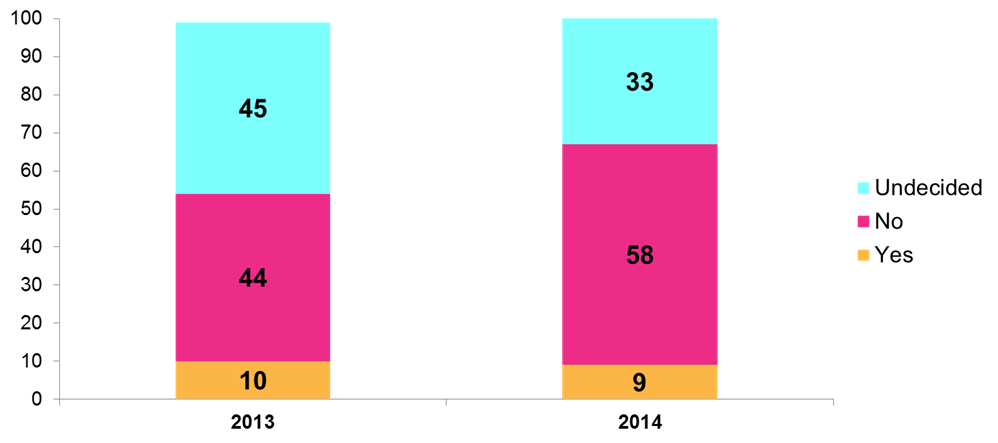
As in 2013, an important group of undecideds is those who favour maximal devolution. The gap in the proportion of undecideds between those favouring maximal devolution and other voters is smaller now, but still there, as Figure 2 shows. It is worth noting that the drop in indecision amongst maximum devolutionist nearly entirely benefits the No side whose vote has increased amongst this group.
Figure 2. Voting intention of those favouring maximum devolution
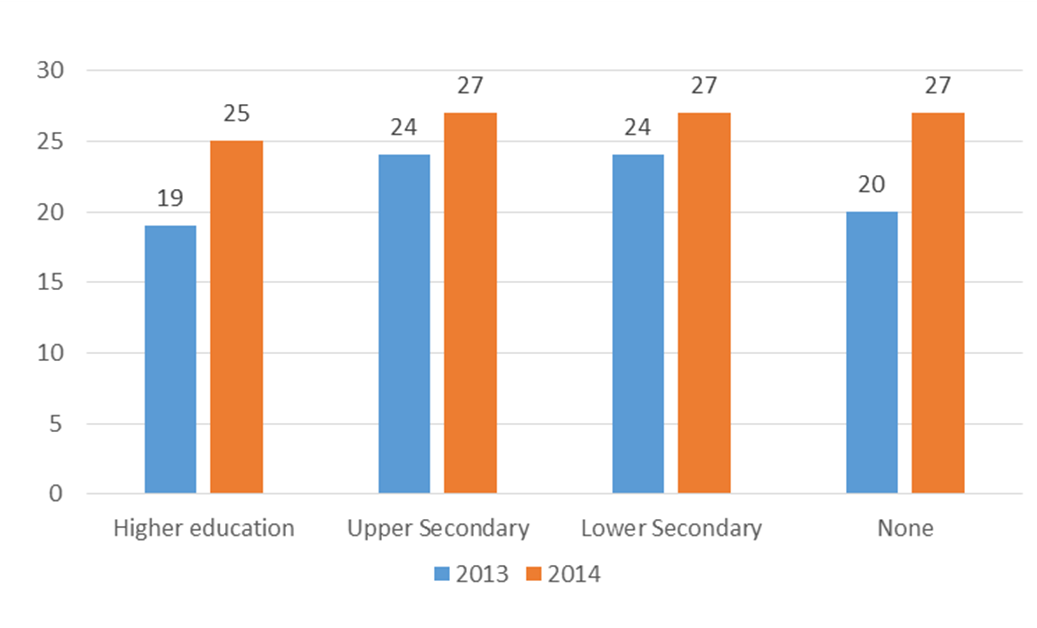
 A topic which has not previously been investigated in connection with the undecideds is education, summarised here by the highest qualification attained. One notable change has taken place with respect to education: in 2014, the percentage intending to vote Yes was almost the same in all the education categories shown in Figure 3, whereas in 2013 the Yes percentage was higher for the two middling education categories. This weakening of the relationship between education and constitutional preference is unprecedented, as the long series of SSAs show when we use longer-established measures of constitutional preference.
Figure 3. Percent Yes, by education
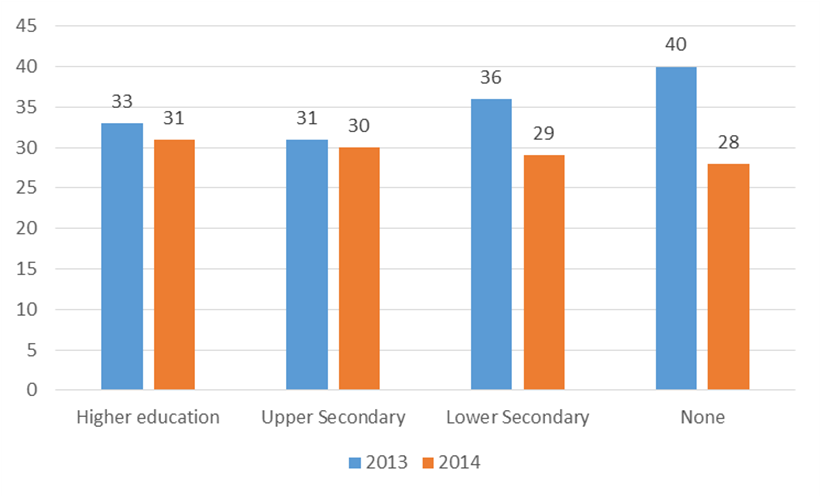
Yet at the same time, the well-educated are also now more likely than other educational groups to be undecided how they will actually vote, in contrast to 2013: see Figure 4.
Figure 4. Percentage undecided, by education
So those with lower levels of education are making up their minds more quickly. This is especially so among those with low education who favour maximal devolution, who are now overwhelmingly likely to vote No: around two thirds intend to do so.
For further details on these undecided votes, the full briefing paper is available online.
About the author
Dr Jan Eichhorn is a research fellow at the University of Edinburgh’s School of Social and Political Science. His research focuses on issues of political participation as well as subjective well-being.