Clearly the most important features of the referendum result are which side won and which lost, and how politicians react and respond to the outcome. But there is also another question to be asked of the result – how well did the polls do and which was closest to the result?
Here is a table of what might be considered the each company’s final poll. For this purpose a final poll is defined as one that was the last that the company conducted and was one for which the fieldwork was completed no later than two days before polling day. Five polls fit that definition.
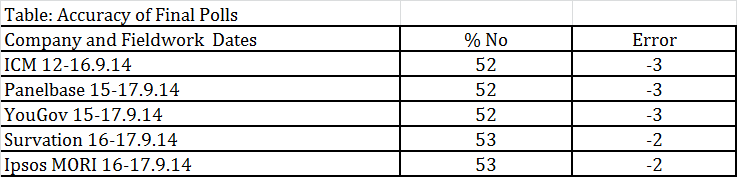
Each of them correctly identified that No would win. Moreover each of the companies can legitimately argue that the error in its poll final is no greater than the margin of error of +/-3 points to which all polls are subject. However, the error was not random, but all in one direction, that is underestimating No strength. That is suggestive of some kind of systematic error rather than just the misfortune of random chance. Steve Fisher’s warning on this site earlier in the week that polls have a tendency to overestimate Yes support in referendums on constitutional change appears to have been prescient.
One possible source of such error is ‘late swing’, that is people changing their minds at the last minute. For that there is some evidence. It will be noted that those final polls whose fieldwork was confined to the last two days of the campaign had a slightly higher estimate of the No vote than did those whose fieldwork was at least in part conducted before then. Meanwhile, three of the companies actually conducted two separate polling exercises and in each case their second reading obtained a lower Yes vote than did their first one. In the case of Ipsos MORI a poll conducted using the same (phone) methodology 24 hours earlier than that shown in the table put No a point lower on 52%. The Survation poll shown in the table was conducted by phone, but an internet poll conducted by the company (the method it used most often during the campaign) between 12 and 16 September also put No a point lower. Meanwhile, YouGov undertook an ‘on the day’ poll in which they reinterviewed on polling day itself a sample of those whom they had previously interviewed during the latter stages of the campaign, and this exercise put the No vote on 54%, a higher estimate than obtained by any of the polls in the table.
Doubtless while the polling industry will be a little disappointed at apparently having underestimated No support somewhat, it will probably feel that it has emerged relatively unscathed from its attempt to estimate voting preferences in a novel context. For most of the campaign the systematic differences between the polls suggested there was a risk that at least some of them (we were just not sure which ones) would suffer reputational damage for having been seen to have got the referendum result wrong. The convergence in their estimates towards the end of the campaign reduced that risk but created another – that they would all be found to have got it wrong. In the end they have probably just done well enough to have avoided that fate too, while recognising that if there were ever to be a second time they would want to do better.
About the author
John Curtice is Professor of Politics at Strathclyde University, Senior Research Fellow at ScotCen and at 'UK in a Changing Europe', and Chief Commentator on the What Scotland Thinks website.